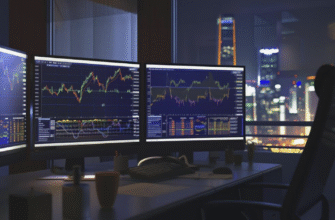
Your chart layout is the cockpit from which you operate. A well-organized workspace helps you read the market quickly, make decisions confidently, and execute without hesitation. A chaotic workspace does the opposite it slows your reactions, creates confusion, and increases the likelihood of costly mistakes.
Most traders spend hours optimizing their strategy but give little thought to how their charts are arranged on the screen. This is a critical oversight. Even the best strategy will underperform if you cannot see the information you need at a glance. Your layout should answer three questions instantly: What is the trend? Where are the key levels? What is my action plan?
For prop traders, the stakes are higher. You are trading under time pressure and drawdown constraints. A clean, logical layout reduces cognitive load, minimizes distractions, and helps you stay focused on execution. It is not about aesthetics it is about creating a workspace that supports disciplined, consistent trading.
- Single-Chart vs Multi-Chart Layouts
- How to Organize Timeframes on the Screen
- Higher Timeframe Context
- Entry Timeframe
- Execution View
- Where to Place Watchlists, News, and Notes
- Best Layouts for Different Trading Styles
- Scalping
- Day Trading
- Swing Trading
- Common Layout Mistakes That Hurt Performance
- Sample Layout Ideas for Prop Traders
- Key Takeaways
- FAQ
- How many charts should a trader watch?
- Is one screen enough for trading?
- Which timeframe should be the main one?
- Do scalpers need more screens?
- How should prop traders organize charts?
- Saving and Restoring Your Layout
Single-Chart vs Multi-Chart Layouts
The first decision in setting up your chart layout is whether to use a single chart or multiple charts simultaneously. Both approaches have merits, and the right choice depends on your trading style.
Single-Chart Layout. A single chart is best for traders who focus on one instrument at a time and use a single primary timeframe. It maximizes screen real estate for that chart, making it easy to see fine details. The downside is that you must manually switch timeframes to get context, which can slow decision-making. Single-chart layouts work well for swing traders who analyze one instrument deeply and do not need to monitor multiple timeframes simultaneously.
Multi-Chart Layout. Multiple charts allow you to view different timeframes or different instruments at the same time. A 2-chart layout might show the 1-hour trend context on top and the 5-minute entry timeframe on bottom. A 4-chart layout might show four different instruments on the same timeframe. The advantage is speed — you see everything at once. The disadvantage is screen clutter and information overload if you include too many charts.
For most day traders and prop traders, a 2-chart layout is the sweet spot. It provides both context and precision without overwhelming the screen. More than 4 charts is rarely useful — it creates noise and slows down decision-making.
How to Organize Timeframes on the Screen
Once you have decided on single or multi-chart, the next step is organizing your timeframes logically.
Higher Timeframe Context
Your higher timeframe chart (daily, 4-hour, or 1-hour) provides trend context. It answers the question: What is the overall market direction? Place this chart in a prominent position — typically at the top of a vertical layout or on the left of a horizontal layout. This chart should be clean, with minimal or no indicators, focusing on pure price action, support, and resistance.
Entry Timeframe
Your entry timeframe (15-minute, 5-minute, or 1-minute) is where you time your entries and exits. Place this chart in the primary position — typically at the bottom of a vertical layout or on the right of a horizontal layout. This is where you will spend most of your time, so ensure it is large enough to see details clearly. You may include 1-2 indicators here for entry confirmation.
Execution View
If your platform supports it, keep your order entry panel visible at all times. In TradingView, this might be the order panel on the right. In MT4/MT5, keep the Terminal Trade tab visible at the bottom. You should be able to execute a trade without switching windows or losing sight of your charts.
Where to Place Watchlists, News, and Notes
Beyond your charts, several supporting panels need a place in your workspace:
Watchlist. Place your watchlist on the right side of the screen (or left, if you are left-handed). Keep it compact — only the instruments you actively trade. Organize with folders if you trade multiple asset classes. The watchlist should be visible but not dominant; your charts are the priority.
News/Economic Calendar. If you follow economic events, keep a small economic calendar panel visible. In TradingView, this is built into the right-side panel. In MT4/MT5, you can dock a browser window or use a plugin. The key is to have it accessible without it becoming a distraction. Disable push notifications for news — check the calendar proactively, do not react to every headline.
Notes. Keep a notepad or digital note-taking tool accessible for recording observations during the session. In TradingView, use the built-in notes feature. In MT4/MT5, use the comments field or keep a physical notebook. Notes should be quick to access and easy to reference during your post-session review.
The guiding principle is: everything in its place. Charts are central, supporting panels are peripheral. Nothing should overlap or obscure your view of price action.
Best Layouts for Different Trading Styles
Different trading styles benefit from different layout configurations:
Scalping
Scalpers need speed and precision. A typical scalping layout uses a 2-chart vertical arrangement: 1-minute or 5-minute chart on top for entry timing, and a slightly higher timeframe (5-minute or 15-minute) on bottom for context. The entry chart should be large, with clear candlesticks and minimal indicators. Keep your order entry panel docked and visible at all times. Watchlist should be minimal — 3-5 instruments maximum.
Day Trading
Day traders benefit from a 2-chart or 3-chart layout. A 2-chart layout shows 1-hour (trend) and 5-minute (entry). A 3-chart layout adds a 15-minute chart for intermediate context. The layout should be vertical (stacked) for easy scanning. Keep indicators minimal — perhaps just moving averages on the entry chart. Place your watchlist on the right and your economic calendar in a corner.
Swing Trading
Swing traders can use a single-chart layout focused on the daily or 4-hour timeframe. Since swing trades develop over days, there is less need for multi-timeframe monitoring. However, a 2-chart layout with daily (context) and 4-hour (entry) can be useful for timing entries more precisely. Swing traders should prioritize chart clarity over speed — larger charts with more drawing space are beneficial.
Common Layout Mistakes That Hurt Performance
Here are the most common chart layout mistakes and how to avoid them:
1. Too Many Charts. More is not better. A layout with 6+ charts creates information overload. You cannot focus on all of them simultaneously, and important signals get lost in the noise. Limit yourself to 2-4 charts maximum.
2. No Clear Hierarchy. All charts should not be the same size. Your primary chart (entry timeframe) should be the largest. Context charts should be smaller. This visual hierarchy guides your attention naturally.
3. Overlapping Windows. Charts, watchlists, and panels should not overlap. Overlapping elements force you to constantly rearrange windows, breaking your focus. Use a tiled or tabbed layout where everything has a fixed position.
4. Inconsistent Timeframes. Do not use random timeframes like 3-minute and 7-minute charts. Stick to standard timeframes (1M, 5M, 15M, 1H, 4H, D) that align with how other traders analyze the market. Standard timeframes have self-fulfilling significance because everyone watches them.
5. Ignoring Screen Real Estate. Do not waste screen space on elements that do not contribute to your decisions. Remove toolbars you do not use, disable news tickers, and hide panels that distract you. Every pixel should serve a purpose.
Sample Layout Ideas for Prop Traders
Here are practical layout configurations optimized for prop trading:
Prop Day Trading Layout (2-Chart Vertical).
- Top chart: 1-hour timeframe, no indicators, pure price action with support/resistance levels
- Bottom chart: 5-minute timeframe, 20 EMA + 50 EMA, larger size for entry precision
- Right panel: Watchlist (8 instruments), alerts, and notes
- Bottom panel: Order entry and position monitoring
Prop Swing Trading Layout (Single Chart).
- Full-screen daily chart with key levels marked
- Right panel: Watchlist organized by sector/asset class
- Bottom panel: Economic calendar for the week ahead
Multi-Instrument Layout (4-Chart Grid).
- Four 15-minute charts showing different instruments (e.g., EURUSD, GBPUSD, XAUUSD, US30)
- All charts use the same template for visual consistency
- Right panel: Combined watchlist and alerts
- Best for traders who monitor multiple correlated instruments
Key Takeaways
- Your chart layout is your trading cockpit. A well-organized workspace improves speed, clarity, and decision quality.
- Most traders benefit from a 2-chart layout: higher timeframe for context, lower timeframe for entry.
- Place your entry chart as the largest and most prominent. Context charts should be smaller.
- Keep watchlists, news, and notes in peripheral positions — they support your analysis but should not dominate.
- Different trading styles need different layouts: scalping favors speed, swing trading favors clarity.
- Avoid common mistakes: too many charts, no visual hierarchy, overlapping windows, and wasted screen space.
FAQ
How many charts should a trader watch?
For most traders, 2 charts is optimal — one for higher timeframe context and one for entry timing. More than 4 charts creates information overload. The goal is not to watch more charts, but to extract more insight from fewer charts.
Is one screen enough for trading?
Yes, one screen is sufficient for most traders. A single 24-inch or larger monitor can comfortably display a 2-chart layout with supporting panels. Multiple monitors become necessary only if you trade many instruments simultaneously or need to monitor order flow across multiple platforms.
Which timeframe should be the main one?
Your main timeframe is your entry timeframe — the one where you time your trades. For day traders, this is typically 5-minute or 15-minute. For swing traders, it is 4-hour or daily. The main chart should be the largest and occupy the primary screen position.
Do scalpers need more screens?
Not necessarily. Scalpers benefit more from a fast computer and low-latency connection than from multiple screens. A 2-chart layout on one screen is sufficient. What matters for scalping is speed of execution, not quantity of charts.
How should prop traders organize charts?
Prop traders should prioritize clarity and speed. Use a 2-chart vertical layout with the entry timeframe as the larger chart. Keep the watchlist minimal and focused on allowed instruments. Place order entry and position monitoring panels within easy reach. Save your layout as a template so it is consistent across sessions. The goal is to reduce friction between analysis and execution.

Saving and Restoring Your Layout
Once you have created an effective layout, save it as a template or profile so you can restore it instantly at the start of each session. Here is how:
TradingView. Click the layout name in the top toolbar and select “Save Layout As.” Give it a descriptive name like “PropDayTrading.” TradingView automatically syncs your layout across devices. You can also save individual chart templates for consistent colors and indicators.
MT4/MT5. Use Profiles to save complete workspace configurations. Right-click a chart tab, select “Profile > Save As,” and give it a name. To restore, select the profile from the same menu. MT4/MT5 also allows you to save chart templates separately.
Best Practice. Save multiple layouts for different scenarios: one for normal trading, one for news events (with economic calendar prominent), and one for end-of-day review. Switch between them as needed rather than constantly rearranging windows.